Parameters for characterizing electrical quantities

Many people dedicate their entire lives to electrical engineering and measurement technology. This illustrates once again how broad and complex this subject is. Because of this, it is not surprising that there is a multitude of different parameters for the characterization of current, voltage or power.
If one does not deal with these parameters on a regular basis, one can quickly lose the overview. Possible mistakes and inconsistencies in field and laboratory tests are inevitable. But do not worry, because in this article we summarize the most frequently used parameters – including an illustrative explanation.
The instantaneous or momentary value
There is AC voltage and there is DC voltage. One can recognize the difference between the two voltage types best when looking at the instantaneous value, also called momentary value. This parameter indicates the value of the voltage (or current) at this exact moment. To identify instantaneous values, small letters such as u(t) or i(t) are often used for voltage and current.
With a DC voltage, the instantaneous value is constant and always the same. This constant parameter alone completely describes and even defines a DC voltage signal.
In contrast, the instantaneous value of an AC voltage changes continuously. In this case, the time course of the instantaneous value represents a periodic signal. This periodic signal can e.g. be a sine wave but may also be a square wave signal.
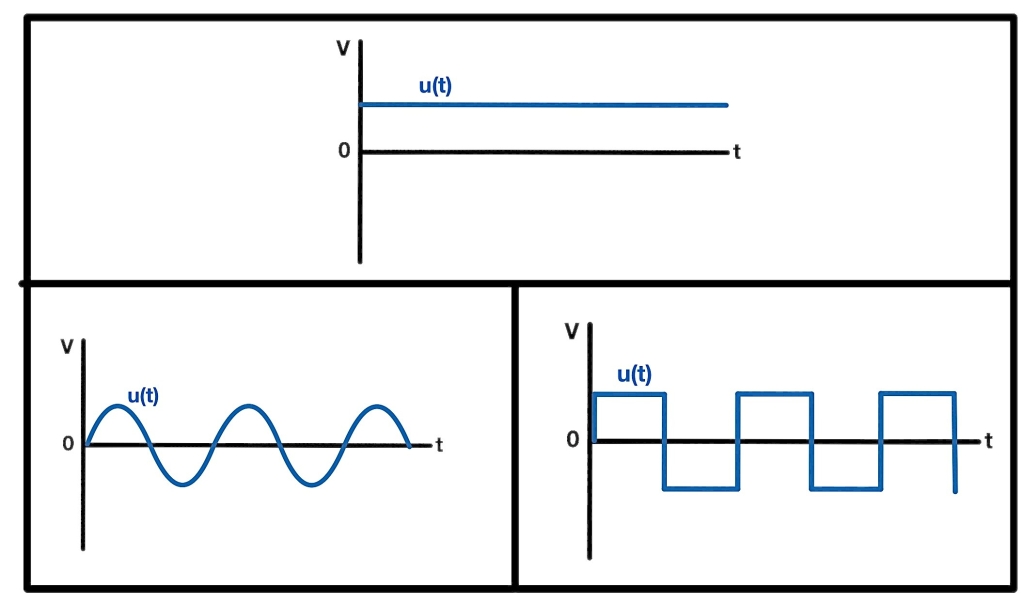
Instantaneous voltage value DC signal (top), AC signals (bottom)
The peak and peak-to-peak value
In order to characterize AC voltages more precisely, other parameters are used in addition to the instantaneous value. These parameters include the peak and peak-to-peak value. To indicate these one adds a subscript character to the quantity like Vp or Vpp.
The peak value is in many cases equivalent to the amplitude of the signal and therefore indicates the maximum displacement from zero. For example, the peak value Vp of the European power grid is 325 V.
The peak-to-peak value is similar to the peak value, but it indicates the distance between the maximum deflection up and downwards. In the case of a sinusoidal signal, the peak-to-peak voltage Vpp is twice the peak value Vp. In general, however, the peak-to-peak value is not always twice as large as the peak value.
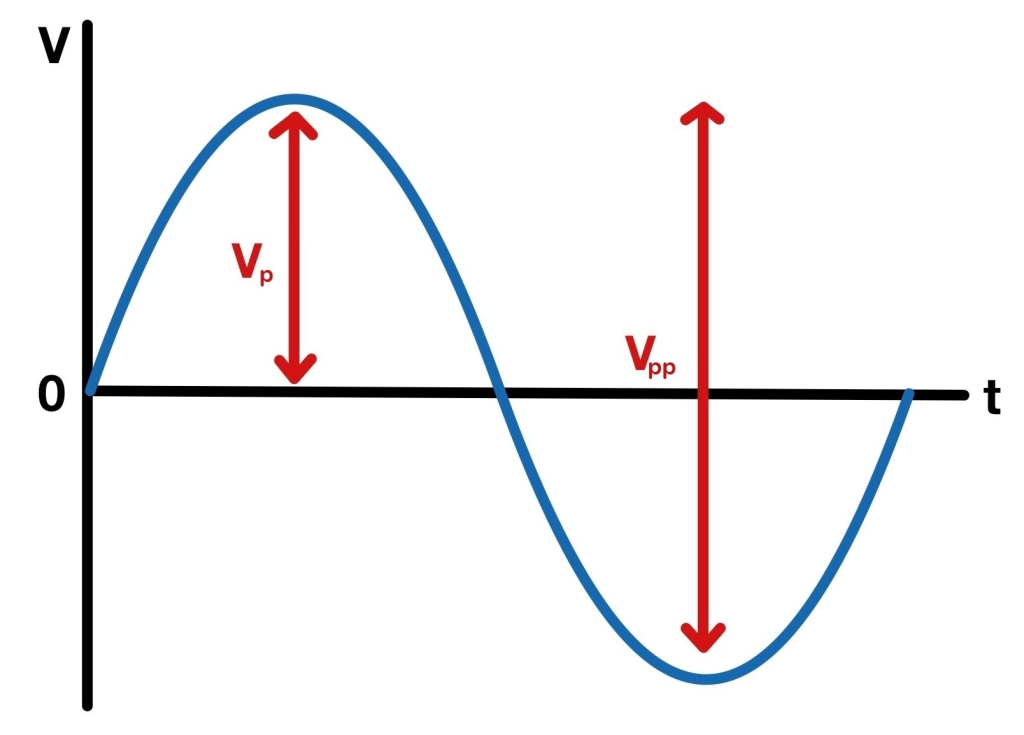
Peak and peak-to-peak value
The effective value
If a parameter does not explicitly indicate whether it is a peak value, peak-to-peak value, instantaneous value, or similar, it almost always refers to the effective value. However, to refer explicitly to the effective value, one uses the designation VRMS or Veff. RMS stands for Root-Mean-Square. This abbreviation indicates how one can calculate the effective value: Square the instantaneous value, then average over it and finally take the root.
The effective value gives the value which a corresponding AC signal needs to have to lead to the same power-dissipation on an ohmic resistor as the DC signal. The RMS value thus indicates the “real” effect of the DC signal. However, since non-ohmic resistors, so-called non-linear components, are also used in many devices, the above statement must be treated with caution. For example, diodes or transistors can increase the RMS value.
In the case of a sinusoidal signal, one can very easily calculate the RMS value using the peak value. In this case, VRMS = Vp / √2. Thus, the effective voltage of the European power grid is found to be the well-known value of VRMS =230 V.
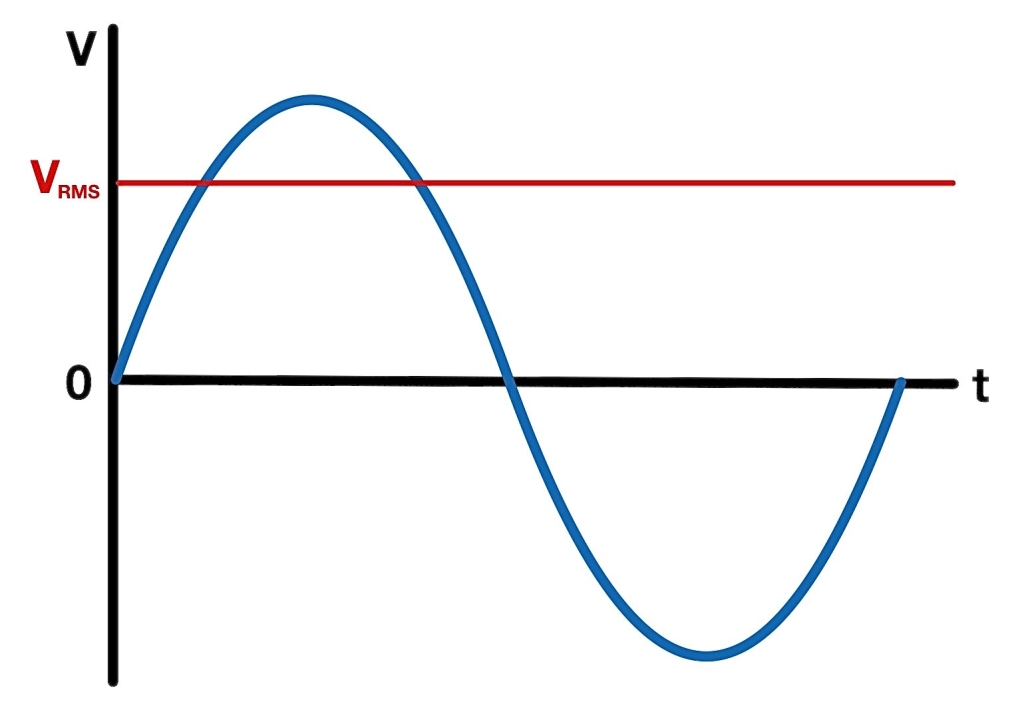
Effective or RMS value
The direct and rectified value
If you look at a pure sinusoidal signal, the instantaneous value of the voltage is negative as often as it is positive. On average, this value is therefore exactly zero. In electrical engineering, one calls this average value also direct value. For the case of an AC signal the direct value is always exactly zero, regardless of whether it is a sine or square wave signal. In DIN 40110, a vanishing direct value even is the defining quantity of an AC signal. In general, if calculating the direct value of non-alternating signals, the result may not be zero. Therefore, it is also possible to give a statement about the deviation of a signal from a pure AC signal by calculating the direct value.
In practice, the direct value is rarely used since it has the same value (zero) for all AC signals. Therefore, for alternating signals one defines the average value in another way, called rectified value. The rectified value is not simply the average over the signal, but the average over the absolute signal. Absolute means that a negative value like -5 V gets converted to a positive value like +5 V. Thus, there are no more negative values.
For a sinusoidal signal the calculation of this parameter is again very simple. One can calculate the rectified value in this case by Vave =2* Vp /π.
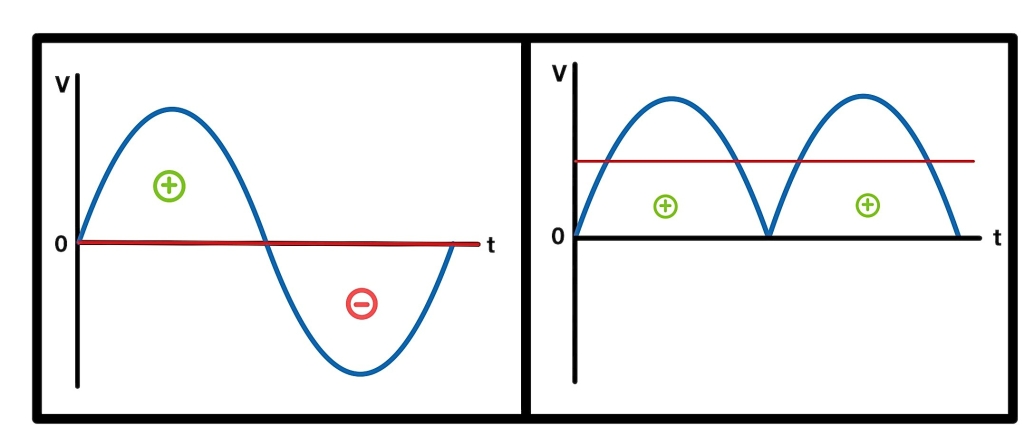
Direct and rectified value
OXYGEN – competent data acquisition made easy
We are DEWETRON and a manufacturer of modular and high-precision DAQ solutions. Our self-developed OXYGEN software makes data acquisition and evaluation easy. Without difficulty, you can determine parameters such as RMS or rectified value. But OXYGEN can do much more: create characteristic curves, analyze harmonics, or detect mechanical faults using a CPB spectrum. Furthermore, with our POWER options, each of your devices becomes a fully-fledged and competent power analyzer.
In addition to our OXYGEN software, we also manufacture a variety of different measurement devices. Those range from dedicated mixed-signal power analyzers and all-in-ones to frontends and mainframes. All our products are of course modular and can therefore adapt exactly to your needs.
Have we caught your interest or do you simply want to learn more about us? Then visit our DEWETRON website where you will find much more content like whitepapers, blogposts or webinars. We are also active on Twitter, YouTube and LinkedIn and would be happy to hear from you.


